 ×1 / 1

统计数据化为3D实体
提示词 Prompt
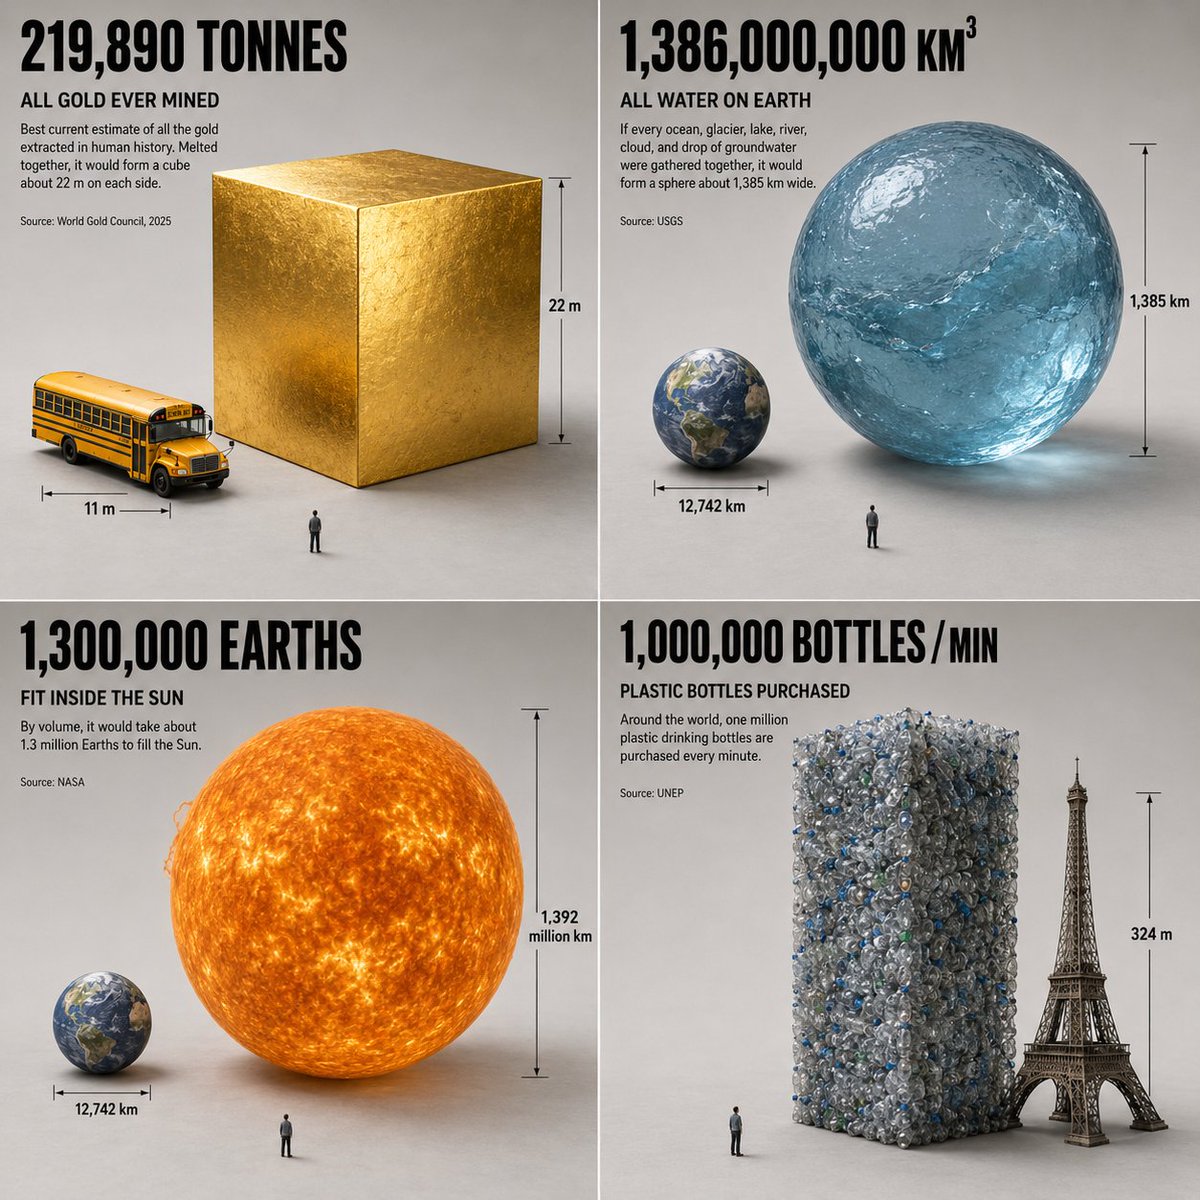
I asked GPT to visualize 4 mindblowing stats. Should work for all kinds of topics. [A clean isometric 3D render that turns a single abstract statistic into a physical object you can feel the weight of — soft studio lighting, matte clay materials, gentle ambient occlusion shadows, a neutral concrete-grey backdrop. The point is scale shock: take a number nobody can intuit and rebuild it as one tangible mass beside a familiar object for comparison (all the gold ever mined as a single cube next to a school bus; every plastic bottle used in one minute stacked into a tower beside the Eiffel Tower; the world's drinking water as one sphere next to the dry planet; a year of human attention given to one app rendered as a mountain beside a person). One precise, oversized hand-set numeral anchors the composition, with a short caption in clean grotesque type stating the metric and its source year. Subtle measurement bars and a tiny human silhouette provide scale. No clutter — generous negative space, one hero object, one comparison. The spirit: a science-museum exhibit model that reframes a statistic as architecture, so a figure you'd scroll past becomes something your body understands.]
采集收录,未经本平台逐条出图验证;原文与效果图来自所标注来源。提示词保留原文。